
Gantt Chart Template
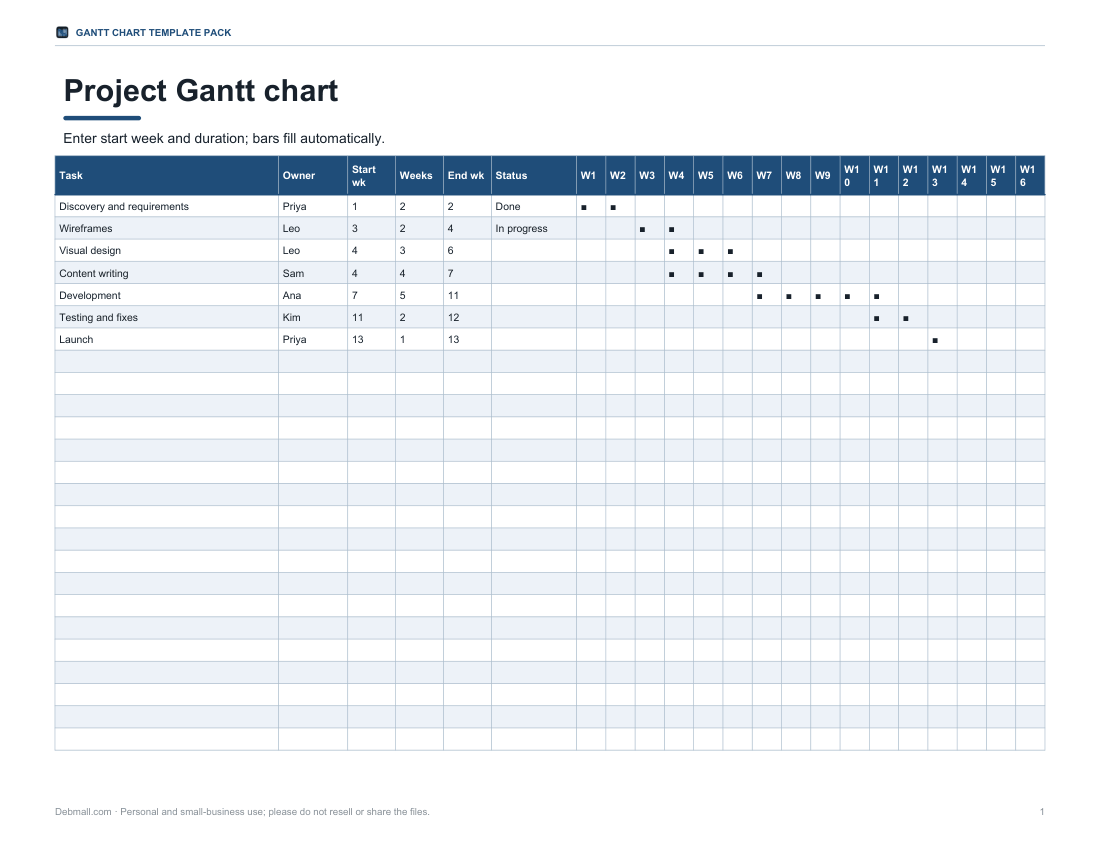
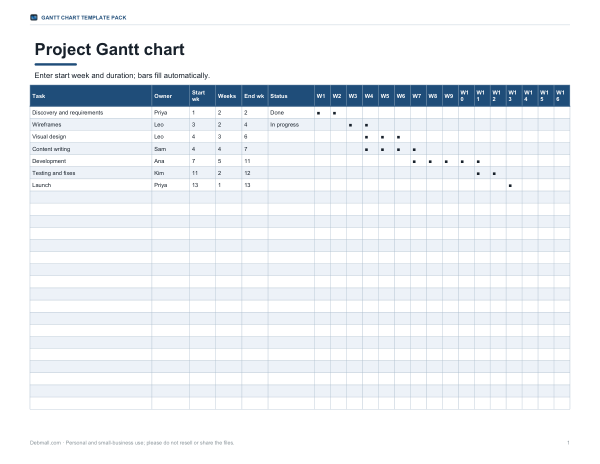
Plan a project on one page. The Excel Gantt chart template draws the timeline for you — enter each task’s start week and duration and the bars appear across a 16-week grid, with end weeks and owners alongside. Printable weekly and monthly Gantt sheets, a task breakdown worksheet and a milestone tracker complete the pack.
- Instant download
- Editable Excel & Word
- Print-ready PDF
- 7-day refund
5 files · XLSX, PDF, DOCX
Gantt Chart Template Pack
Excel Gantt chart with automatic bars (16 weeks), printable weekly and monthly Gantt charts, a Word task breakdown worksheet and an Excel milestone tracker.
- Excel Gantt chart (XLSX)
- Weekly Gantt (PDF)
- Monthly Gantt (PDF)
- + 2 more
$7.00 USD, one-time 5 files · about $1.40 each
- Instant download
- 7-day refund
- Secure checkout by Stripe
7-day money-back guarantee. Full refund within 7 days of purchase, even after you download.
Free sample: Excel Gantt Chart (PDF, 116 KB)
Gantt Chart Template Pack
Excel Gantt chart with automatic bars (16 weeks), printable weekly and monthly Gantt charts, a Word task breakdown worksheet and an Excel milestone tracker.
- Excel Gantt chart (XLSX)
- Weekly Gantt (PDF)
- Monthly Gantt (PDF)
- Task breakdown (DOCX)
- Milestone tracker (XLSX)
Formats: XLSX, PDF, DOCX. Instant download after payment (link valid 72 hours, up to 5 downloads). AI-assisted: the templates were drafted with AI help and reviewed and laid out before publishing.
$7.00 USD, one-time 5 files · about $1.40 each
- Instant download
- 7-day refund
- Secure checkout by Stripe
7-day money-back guarantee. Full refund within 7 days of purchase, even after you download.
Free sample: Excel Gantt Chart (PDF, 116 KB)
Full refund within 7 days — see the refund policy and license.
Free printables
Single sheets you can print right now, no sign-up. The full pack adds every sheet in one download plus the editable files.
 Printable Gantt Chart Template
 Printable Weekly Gantt Chart
 Printable Monthly Gantt Chart
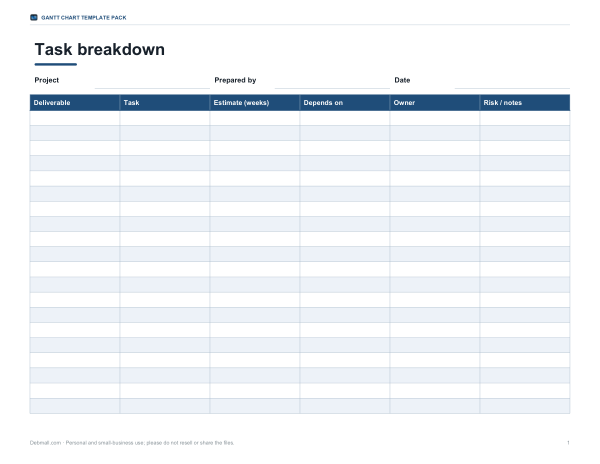 Printable Task Breakdown Sheet
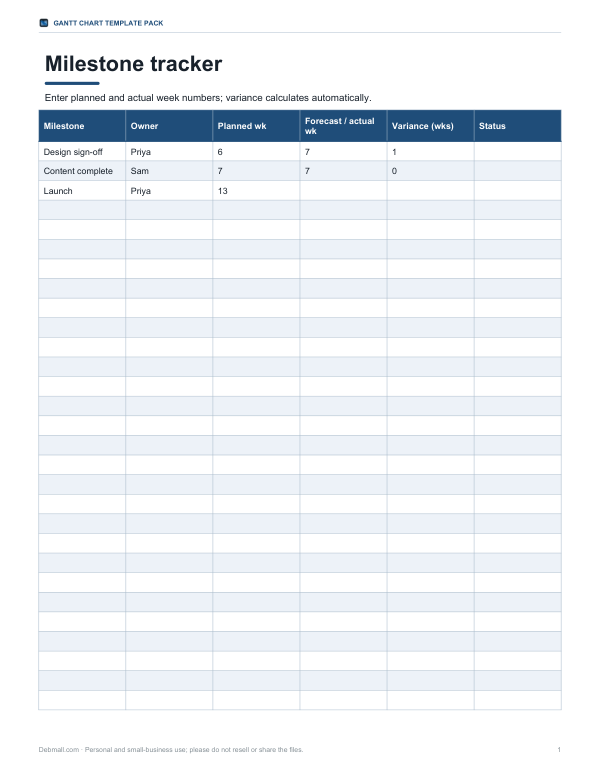 Printable Milestone Tracker
What a Gantt chart shows
A Gantt chart lists a project’s tasks down the left side and shows time across the top. Each task is drawn as a bar from its start to its finish, so you can see at a glance what happens when, which tasks overlap, and how long the whole project will take. Milestones — key dates such as a launch or a sign-off — are often marked with a diamond or a highlighted cell. Named after Henry Gantt, who popularised the format in the early twentieth century, it remains the most widely used way to present a project schedule.
How the Excel template works
| Column | What to enter |
|---|---|
| Task | A short action: “Draft content”, “Build prototype” |
| Owner | The person responsible |
| Start wk | The project week the task begins (1, 2, 3 …) |
| Weeks | How many weeks the task takes |
| End wk | Calculated automatically |
| Status | Not started / In progress / Done / Blocked |
| W1–W16 | Bars fill in automatically with ■ |
Change the start week or duration and the bar moves. Insert rows for extra tasks and copy the formulas down. For projects longer than 16 weeks, copy the last week column to the right and change the week number in the formula.
Building a good project plan
- List the deliverables — what the project must produce.
- Break each deliverable into tasks of one to four weeks; smaller tasks are easier to estimate and track.
- Put tasks in order and note dependencies — which tasks must finish before others can start.
- Estimate durations with the people doing the work, and add a buffer for risk.
- Assign one owner per task.
- Mark milestones such as approvals, launches and reviews.
- Share the chart and update it weekly.
Dependencies and the critical path
Some tasks cannot start until another finishes: you cannot test a product before it is built. The longest chain of dependent tasks from start to finish is the critical path; any delay on it delays the whole project. Tasks off the critical path have slack and can slip a little without changing the end date. Knowing which tasks are critical tells you where to focus attention and resources. Simple templates show dependencies with notes; dedicated project software can calculate the critical path automatically.
Templates in the pack
- Excel Gantt chart — automatic bars over 16 weeks, sample tasks included.
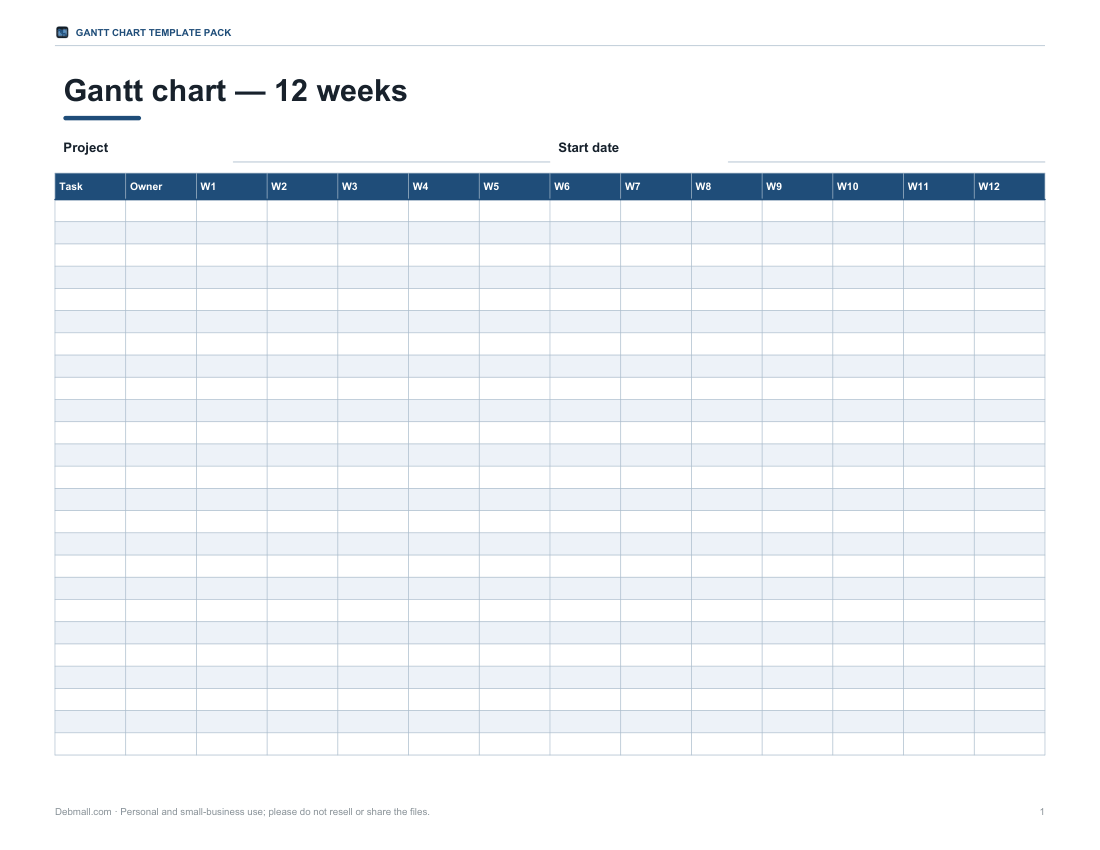
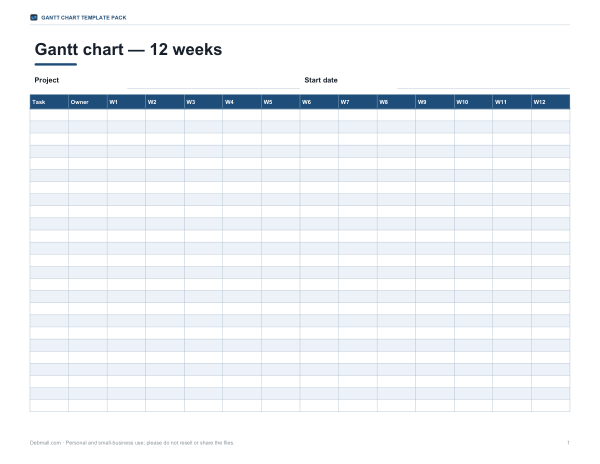
- Printable weekly Gantt chart — 12 weeks, for sketching plans by hand.
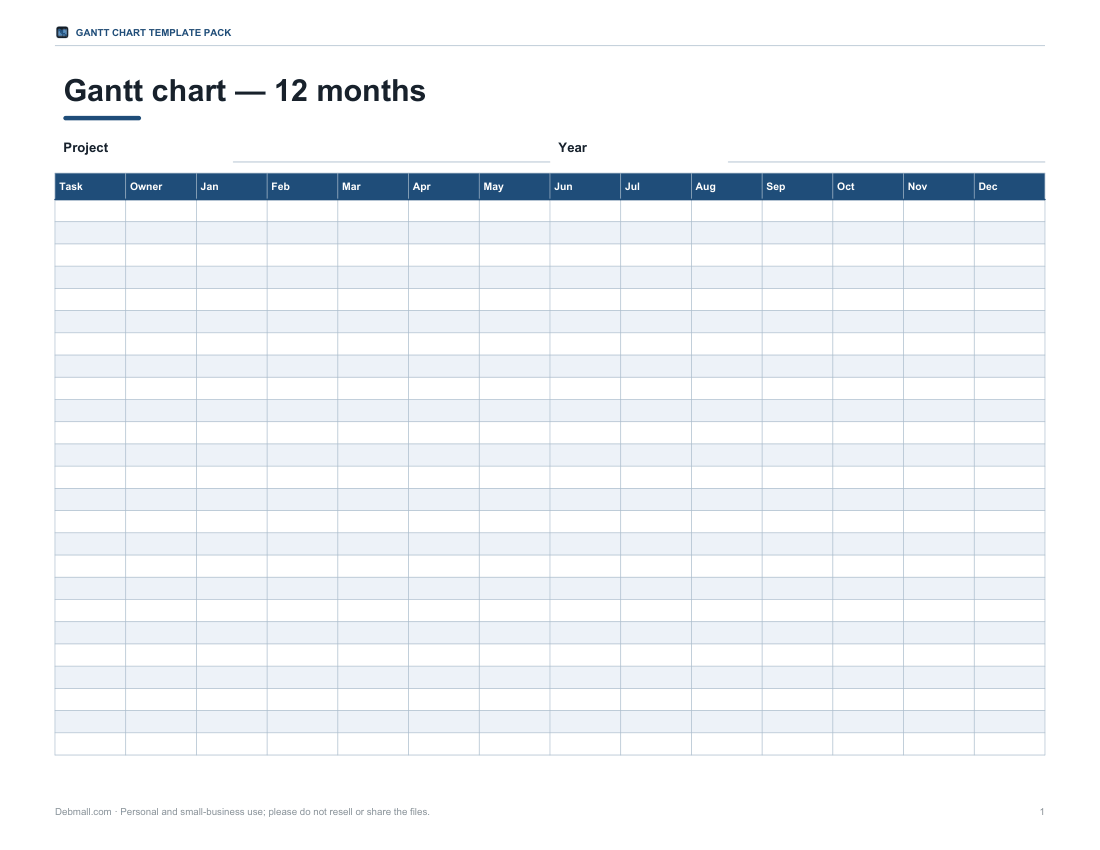
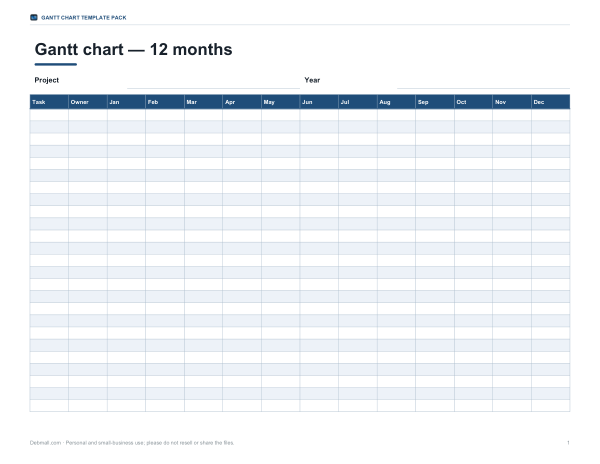
- Printable monthly Gantt chart — 12 months, for long projects and annual plans.
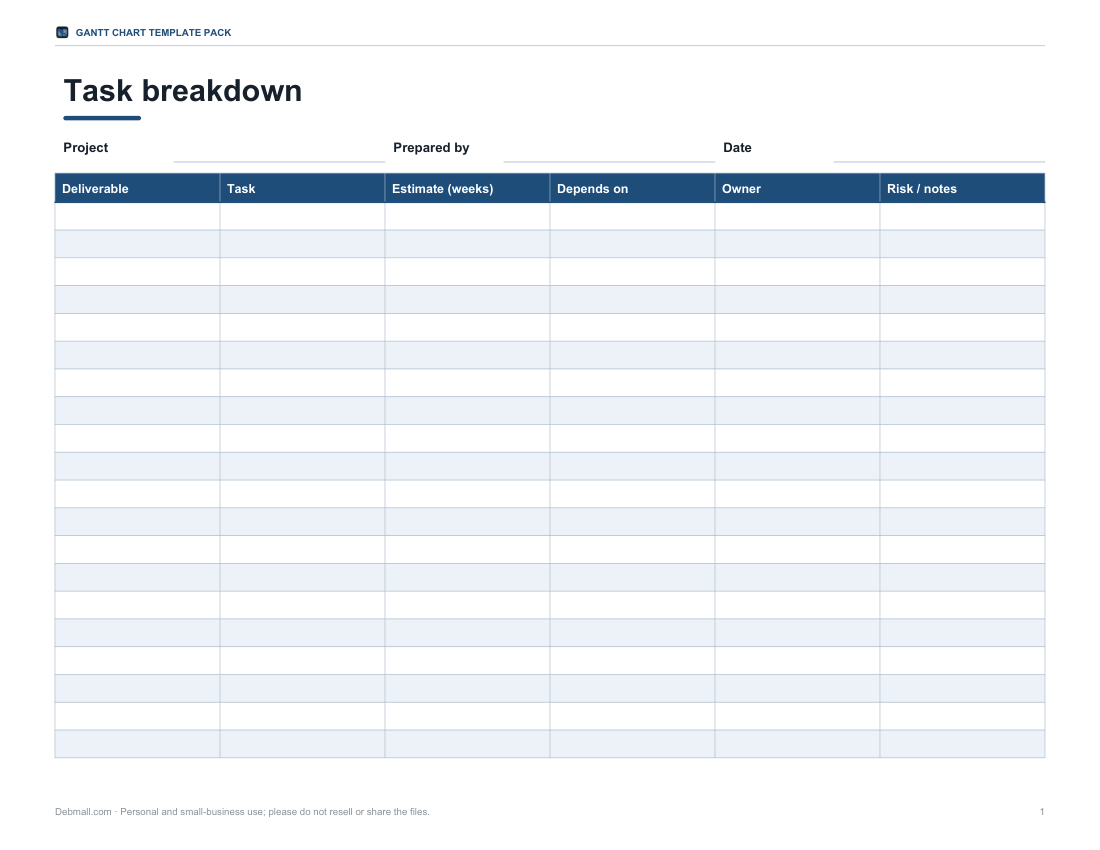
- Task breakdown worksheet (Word) — list deliverables, tasks, estimates and dependencies before building the chart.
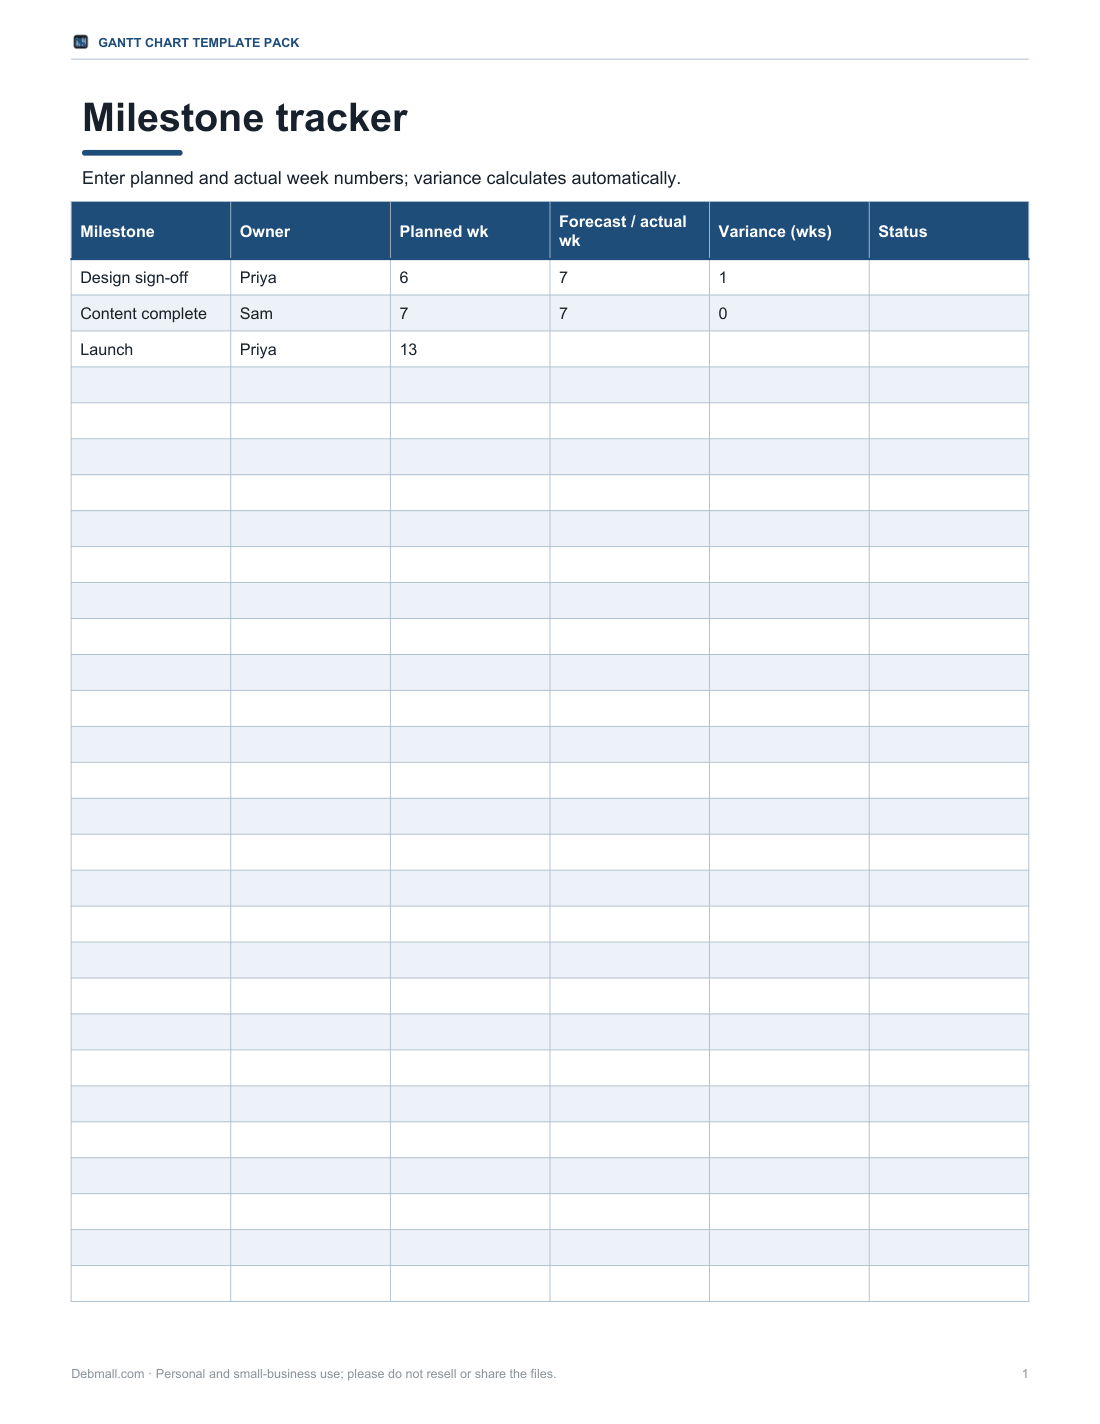
- Milestone tracker (Excel) — planned vs actual dates with days of variance.
Example: a website redesign
| Task | Start wk | Weeks |
|---|---|---|
| Discovery and requirements | 1 | 2 |
| Wireframes | 3 | 2 |
| Visual design | 4 | 3 |
| Content writing | 4 | 4 |
| Development | 7 | 5 |
| Testing and fixes | 11 | 2 |
| Launch | 13 | 1 |
Visual design overlaps with wireframes by one week, and content runs in parallel with design. Development starts after design sign-off, so design → development → testing → launch forms the critical path.
Keeping the chart useful
- Update status every week in a short meeting.
- Record changes rather than silently moving bars — note why a task slipped.
- Keep it readable: 15–30 tasks on the main chart, with detail in sub-plans.
- Colour or flag blocked tasks.
- Share a PDF snapshot with stakeholders who do not need the spreadsheet.
Formats
Excel Gantt chart and milestone tracker (with formulas), Word task breakdown worksheet, and printable PDF weekly and monthly Gantt charts (US Letter landscape; A4 with “Fit to page”).
Frequently asked questions
How do I make a Gantt chart in Excel?
List tasks with a start and duration, then fill timeline cells with a formula or conditional formatting; the template does this for you.
Can I change the number of weeks?
Yes, copy the last week column and update its week number.
What is a milestone?
A key checkpoint with no duration, such as a sign-off or launch date.
What is the critical path?
The longest chain of dependent tasks; delays on it delay the whole project.
Does it work in Google Sheets?
Yes, upload the XLSX file; the formulas work in Google Sheets.
Was AI used to create the template?
The files were generated by script and the text drafted with AI assistance, then reviewed before publishing.